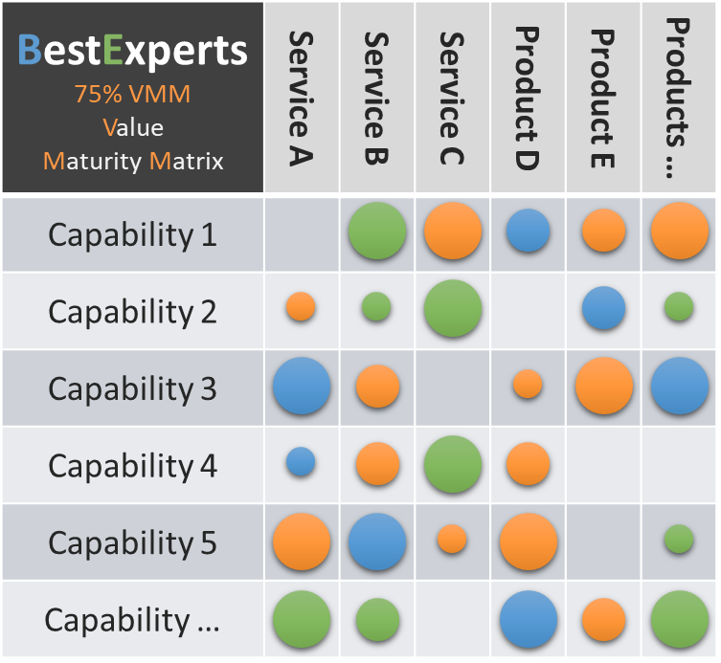
A simplified Capability Value Score card with KPIs and the Value Maturity Matrix for products and services below to explain the purpose. It can certainly be broken down into individual KPIs for each component and capability area.
Simplified Score Example
In this simplified version, each capability area from demand to value has a set of KPIs with associated maturity levels. The matrix provides a quick visual representation of the maturity level for each service and product by each capability. The colors represent the initial, managed, defined, measured and optimized maturity levels of each KPI and capability. Regularly updating and analyzing this matrix can guide strategic decisions and improvement initiatives across the organization. Below you will find a summary of each aspect.
Teams and People
In your digital transformation (DX) journey, we prioritize an approach that focuses on intelligence from existing enterprise and operational data in current BD, BRM, CRM, ERP and other tools. We focus on motivating qualified individuals, empowering teams to extract value from meaningful information, and improving the customer experience. We look to the future and integrate new technologies and AI/ML into the toolkit, expanding the capabilities of popular platforms such as Salesforce, Microsoft Dynamics 365, HubSpot, Zendesk, Freshdesk, Nimble, SAP, Oracle, NetSuite and more.
Tools
From Business Development (BD) and Business Relationship Management (BRM) to Customer Relationship Management (CRM), Sales and Enterprise Resource Planning (ERP), we ensure that each tool acts as an enabler, not just a solution, in the quest for sustainability serves tools such as Truvalue Labs, Sustainalytics, MSCI ESG Research and SASB Navigator to align operations with environmental, social and governance (ESG) principles.
Value Maturity Score with KPI
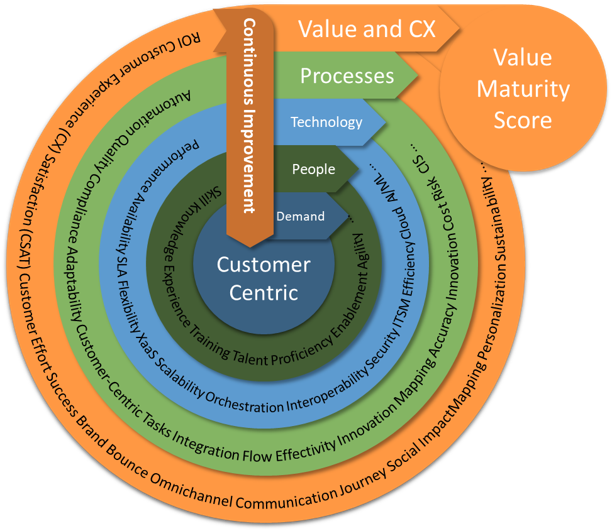
Defining customer-centric, value-focused KPI score for each capability involves aligning metrics with key business and operational drivers that combines performance and maturity of capabilities from Demand, People, Technology, Processes, to Value, and Customer Experience.
Not all Performance Indicators are necessarily Key. KPIs have a strategic significance and play a crucial role in helping to track progress toward achieving their high-level objectives. The choice of KPIs depends on the organization’s goals, industry, and specific areas of focus. Both PIs and KPIs are essential tools for performance management, providing valuable insights for decision-making and continuous improvement.
Examples for Demand Performance Indicators
- Forecast Accuracy Rate
- Customer Demand Satisfaction Rate
- Customer Satisfaction with Demand Fulfillment
- Inventory Turnover Rate and Stockout Rate
- Order Fulfillment Efficiency, Order Processing Time
- Perfect Order Rate
- Demand Planning Effectiveness Rates
- Lead Time Variability
- Supply Chain Visibility, End-to-End Visibility Index
- Agility in Demand Response Rate
- Time to Market for New Products/Services
- Time to Adjust Level
- Dynamic Pricing Effectiveness Rates
- Price Optimization Impact, Competitive Price Index
- Capacity Planning Success Rate, Capacity Utilization Rates
- Resource Allocation Efficiency
- Channel Performance Rate, Sales Channel Effectiveness
- Return on Investment (ROI) Rate
- Profitability Growth Rate
- Demand Collaboration Metrics, Demand Signal Accuracy
- Customer Retention Rate
- Customer Lifetime Value (CLV)
- Customer Acquisition Cost (CAC)
- Lead-to-Customer Conversion Rate
Examples for People Performance Indicators
- Digital Skills Proficiency, Skill Assessment Scores
- Learning and Development, Training Participation Rates
- Completion Rates
- Adaptability and Change Management
- Adoption Rates, Change Readiness Surveys
- Digital Collaboration Tools Usage
- Cross-functional Collaboration Metrics
- Innovation and Problem-Solving
- Ideation and Innovation Metrics
- Problem Resolution Time
- Project Delivery Efficiency, Project Completion Timelines
- Customer-Centric Skills
- Customer Satisfaction Scores
- User Experience Metrics
- Digital Leadership Competency
- Employee Engagement Rates
- Retention Rates
- Diversity in Digital Roles
- Inclusive Collaboration Metrics
- Digital Project Collaboration
- Knowledge Sharing Rates
Examples for Technology Performance Indicators
- System Performance, Uptime Percentage, Response Time
- Security Incident Rate, Compliance Adherence
- Server Utilization Rates, Network Latency
- Data Accuracy and Completeness
- Data Storage Efficiency
- Rate of Technology Adoption, Innovation Index
- Scalability and Flexibility
- Integration Success Rates, Interoperability Index
- Cloud Service Utilization, X as a Service Utilization
- Cost Savings from Adoption
- User Experience of App Performance, User Satisfaction
- Automation and AI/ML Rate, Automation Efficiency
- Accuracy of Predictive Analytics
- IT Service Management Fulfilment
- OSS Service and Service Desk Satisfaction
- Technology Cost per User/Transaction
- Return on Technology Investments (ROTI)
- Continuous Improvement Factors
- Feedback Loop Effectiveness
- Technology Optimization Index, Technology Adoption Rate
- Innovation System Uptime
Examples for Processes Performance Indicators
- Cycle Time, Throughput Rates
- Percentage of Automated Processes
- Quality and Error Rates
- Process Compliance, Compliance Adherence Rates
- Audit Findings and Recommendations
- Adaptability Index, Agile Implementation Success
- Customer-Centric Processes
- Net Promoter Score (NPS)
- Integration Success Rates
- Data Flow Efficiency
- Resource Utilization
- Process Documentation Completeness
- Process Mapping Accuracy
- Ideation and Process Innovation Metrics
- Success Rate of Innovative Process Changes
- Cost per Process Transaction
- Return on Process Optimization Investments
- Risk Mitigation Effectiveness
- Incident Response Time
- Continuous Improvement Culture Index
- Kanban or Lean Metrics
- Customer Journey Completion Rate
- Process Value Efficiency
Examples for Value and CX Performance Indicators
- Value Metrics Factors on Revenue Growth
- Value Metrics Factors on Profitability
- Cost Savings Implementation Rate, Operational Cost Reductions
- Return on Investment (ROI) Rate
- Cross-Selling and Upselling Offering Rate
- Success Rates of Cross-Selling and Upselling
- Time-to-Market Launch for New Features
- Time to Design and Develop New Features
- Product/Service Adoption Rates
- Customer Lifetime Value (CLV)
- Brand Loyalty Metrics
- Digital Transformation Impact on Cost Savings
- Impact DX on Business Processes Optimization Rate
- DX Innovation Effectiveness to Sales and BD
- Carbon Footprint and Energy Consumption
- Waste Generation and Recycling Rates
- E2E Supply Chain Sustainability
- Innovation and Invest ESG Rating
- Eco-Efficiency Metrics
- Social Impact Metrics
- Sustainable Product or Service Metrics
- Employee Diversity and Inclusion Metrics
- Community and Society Engagement
- Social Responsibility Reporting
- Sustainable Innovation on ESG Measures
- Customer Experience (CX) Metrics
- Customer Satisfaction (CSAT), CSAT Scores
- Net Promoter Score (NPS), NPS Ratings
- Customer Effort Score (CES)
- User Experience (UX) Metrics
- Task Success Rate
- Channel Performance
- Conversion Rates, Bounce Rates
- Omnichannel Integration Index
- Customer Journey Analytics Rate
- Customer Journey Mapping Effectiveness
- Personalization Metrics Factors
- Customer Retention Rate, Customer Churn Rate
- Repeat Purchase Rates
- Customer Feedback Rate, Feedback Response Time
- …
Communicate KPIs, goals and expectations to all relevant stakeholders and provide training on how to interpret and use KPI data. Establish regular performance review intervals to conduct reviews and evaluate KPI performance against objectives. Regularly analyze KPI data to identify trends and patterns and interpret data to understand impact on business capabilities.
Use KPI data to identify areas where performance is falling short of goals to determine the root causes of performance issues. Develop action plans to address performance gaps and assign responsibilities for implementing corrective actions. Monitor the impact of corrective actions on KPIs and adjust KPIs and goals based on changing business conditions.
Building tailored and comprehensive business capability KPIs involves multiple tasks, functions and elements. A step-by-step guide covers every phase, from defining KPIs to monitoring and improving performance. Clearly articulate overall business objectives to align business objectives with key areas such as demand, people, technology, processes and value.
This holistic approach ensures that when executing all aspects of the business, we focus on delivering value to customers while continually improving internal processes and technologies.
Regularly reviewing and updating KPIs, performance maturity, and value and customer experience initiatives helps companies keep pace with changing needs and expectations.
Value Maturity Matrix with Capabilities
Putting Capability Maturity into a Matrix for Value and Customer Experience (CX) helps to assess and improve capabilities in delivering value to customers. The Value Maturity Matrix typically outlines maturity levels and associated characteristics of capabilities to deliver best-in-calls products and services, allowing organizations to identify their current state and set goals for advancement.
- Level 1: Initial
Ad-hoc value propositions with inconsistent alignment to customer needs. Minimal focus on understanding customer expectations. Reactive approach to customer issues. Limited or not formalized customer feedback mechanisms. - Level 2: Managed
Defined value propositions with basic customer segmentation. Basic understanding of customer pain points. Formalized processes for handling customer feedback. Basic customer journey mapping initiated. - Level 3: Defined
Well-defined value propositions tailored to specific customer segments. Comprehensive understanding of customer needs and preferences. Proactive approach to customer issues and feedback. Comprehensive customer journey mapping and analysis. - Level 4: Measured
Quantifiable metrics for value creation and customer impact. Continuous monitoring of customer value delivery. Real-time monitoring of customer satisfaction metrics. Continuous improvement initiatives based on customer feedback. - Level 5: Optimized
Continuous innovation in value propositions. Value metrics integrated with overall business performance. Proactive identification and resolution of potential CX issues. Integration of customer experience metrics with strategic decision-making.
Implementing a Value Matrix to visualize the maturity of capabilities to provide customer-centric, value-focused products and services be a powerful tool for assessing, visualizing, and improving your organization’s ability to provide solutions that maximize value and customer experience.
Creating this matrix with capability areas listed horizontally and maturity levels visualized in each capability for products and services vertically to be used in a color-coded system and size to indicate the maturity level of each capability and its priority for the product and service. This provides a quick visual representation of areas that need improvement and those that are performing well.
The capabilities needed for delivering products and services with value and a positive customer experience (CX) can vary across industries:
Technology Sector
- Innovation and Research
- Software Development
- Cybersecurity
- User Experience (UX) Design
- Data Analytics
- Project Management
- Quality Assurance
- Cloud Computing
- Agile Development
- Customer Support and Training
Healthcare Sector
- Patient Care and Treatment
- Health Information Management
- Regulatory Compliance
- Telehealth Services
- Electronic Health Records (EHR)
- Medical Research
- Healthcare Analytics
- Interoperability Solutions
- Medical Imaging Technology
- Patient Engagement
Financial Services Sector
- Risk Management
- Regulatory Compliance
- Financial Analysis
- Digital Banking
- Fraud Detection and Prevention
- Customer Relationship Management (CRM)
- Data Security and Privacy
- Investment Management
- Mobile Banking Solutions
- Financial Planning and Advisory
Retail and E-Commerce Sector
- E-commerce Platforms
- Supply Chain Management
- Inventory Optimization
- Omnichannel Integration
- Customer Relationship Management (CRM)
- Data Analytics for Personalization
- Digital Marketing
- Logistics and Fulfillment
- Customer Support and Engagement
- User-friendly Website and App Design
Manufacturing Sector
- Lean Manufacturing
- Quality Control and Assurance
- Supply Chain Management
- Process Automation
- Product Lifecycle Management (PLM)
- Advanced Manufacturing Technologies (e.g., 3D printing)
- Environmental Sustainability Practices
- Supplier Collaboration
- Operational Efficiency
- Health and Safety Compliance
All of these are general capabilities that are specified together with customers and companies at the portfolio, strategy or even at the unit, team, function or role level. Within each sector, different capabilities and KPIs can be prioritized based on their business models, strategies, operations, etc. and current market trends. Interdisciplinary skills such as data analysis, digital transformation and customer-centric design are becoming increasingly important across industries.
This visual representation enables rapid assessment and strategic planning to advance capabilities to a higher level of maturity and ultimately improve overall value and customer experience. Update the matrix regularly to reflect improvements and changes in your organization’s capabilities.
The size represents the weighted assessment score for each KPI based on its strategic importance and priority of each capability. The overall score combines individual KPI scores into a customer-centric, value-oriented overall score for each capability.
Regularly review and coordinate with other units, functions, suppliers and partners, or with customer and market demand, to adjust these capabilities and KPIs based on changing business goals, industry trends and customer feedback.
Define the required core competencies in demand management, people management, technology, processes and value creation and align the skills with business objectives. Assign responsibility for each KPI to specific owners and identify stakeholders involved in the KPI management process. Collaborate with stakeholders to gather input on critical KPIs. to ensure alignment between KPIs and business goals.
Identify KPIs that align with business capabilities and goals and choose a mix of leading and lagging indicators for a comprehensive overview. Set specific, measurable, achievable, relevant and time-bound (SMART) goals for each KPI. and define thresholds for acceptable performance.
Identify the data sources required for each KPI to determine data collection methods and frequency. Ensure data accuracy, consistency and reliability to establish data ownership and governance policies.
Implement the VMM tracking system or dashboard and configure the system to automate data collection and visualization. Determine baselines for each KPI and use historical data to set benchmarks.
Document capabilities and KPI definitions, methodologies and goals and prepare regular reports for managers and stakeholders. Assess the effectiveness of maturity and KPI tracking tools and consider upgrades or changes to better meet changing needs. Regularly review the entire matrix up to the KPI framework for relevance and optimize KPIs and capabilities based on organizational changes and strategic shifts.
Building and managing a robust CIS and KPI management system is an ongoing process that requires collaboration, analysis and a commitment to continuous improvement. Regularly review and refine the KPI and Capability Maturity Framework to ensure it continues to align with the organization’s strategic objectives and business capabilities.
Organizations can use this matrix to self-assess their current capabilities and strategically plan initiatives to achieve higher levels of maturity. Regular reviews can lead to continuous improvements in creating value and improving customer experience in products and services.
Fostering a culture of continuous improvement is critical to adapting to change as part of a digital transformation towards added value and customer satisfaction based on business goals and objectives.
By integrating these practices, companies build a dynamic and adaptable culture that thrives on continuous improvement and ensures sustained alignment with evolving customer experiences and business value goals.
At BestExperts we aim to emerge as your business initiator and sales enabler, specialized on tech startups or technology players entering new markets. Within our assessment and initiative program, we are prioritizing a strong foundational pipeline and drive partner opportunities, evaluating the potential for a mid-term-plan in the first months to success, protecting ventures and driving business initiatives.